
Powerful features to get the alcohol sales data you need.
Access detailed insights into Texas alcohol sales through our powerful data platform. Create custom reports, analyze market trends, and visualize performance across locations through an intuitive interface designed for data-driven decisions.
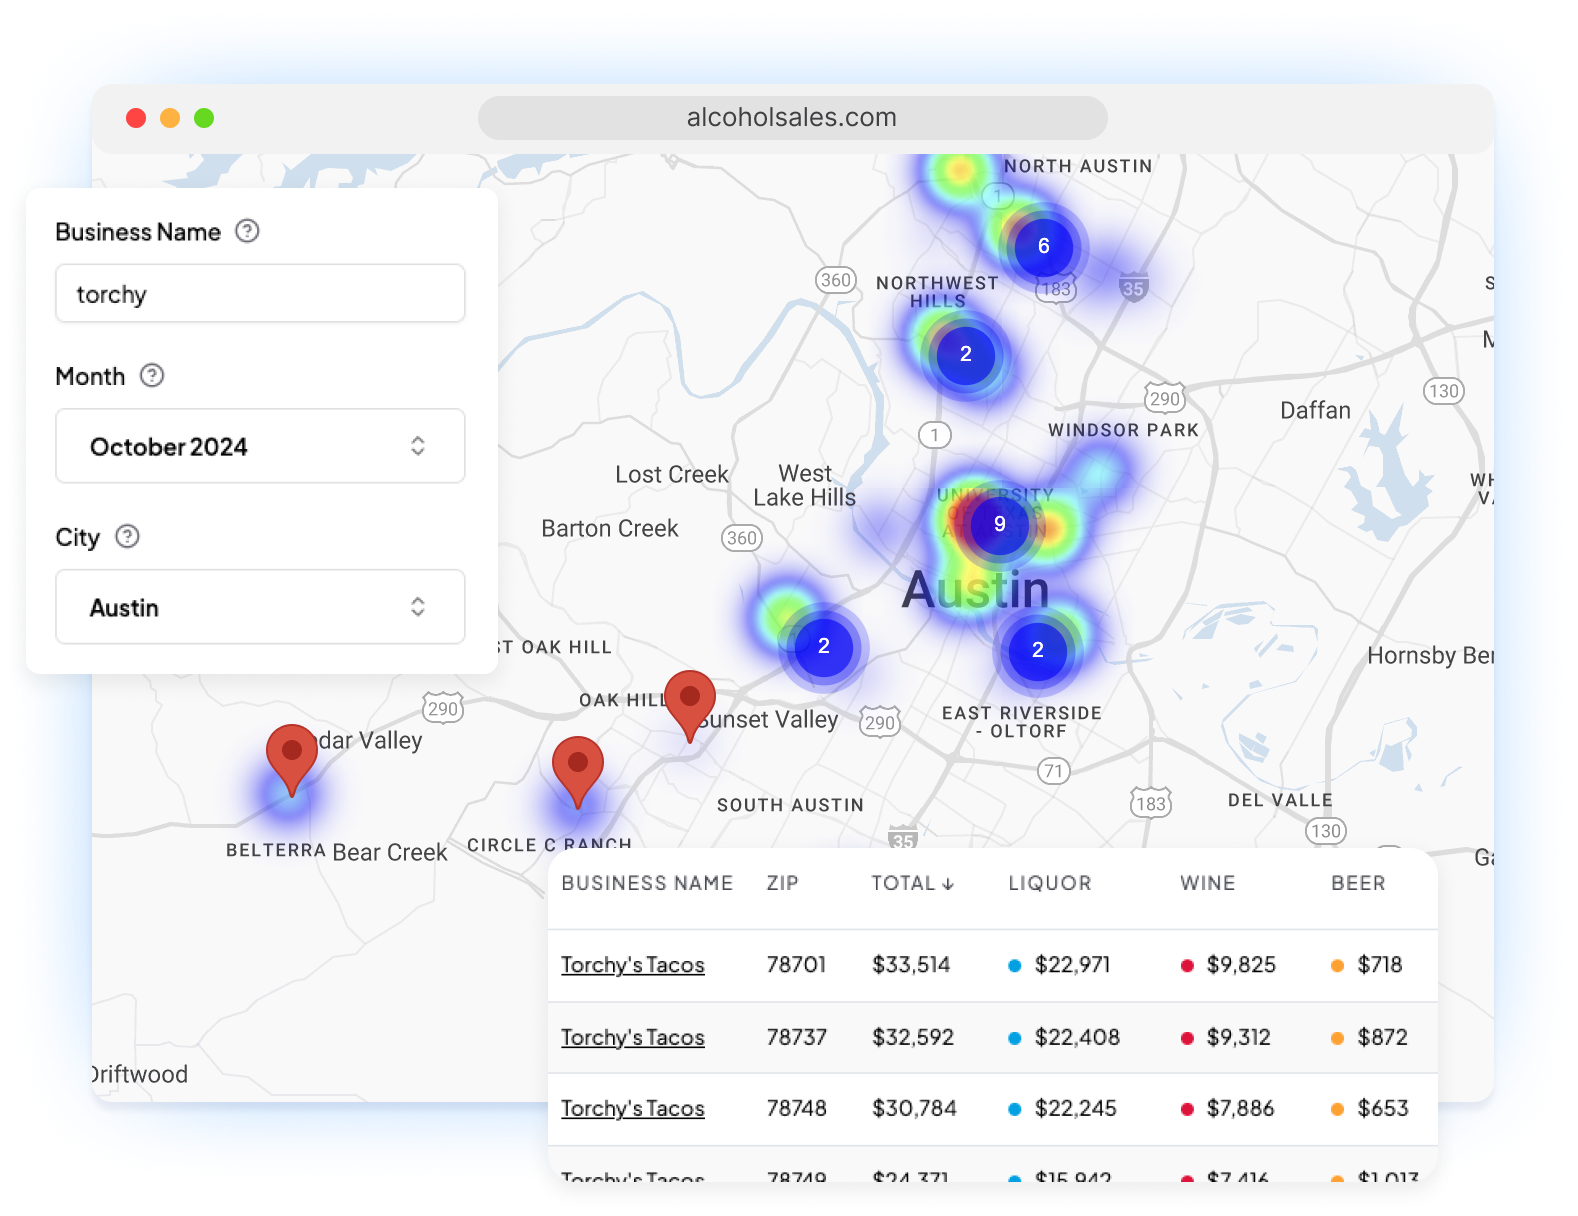

View alcohol sales data for any bar or restaurant in Texas.
Bar & restaurant alcohol sales trends at a glance
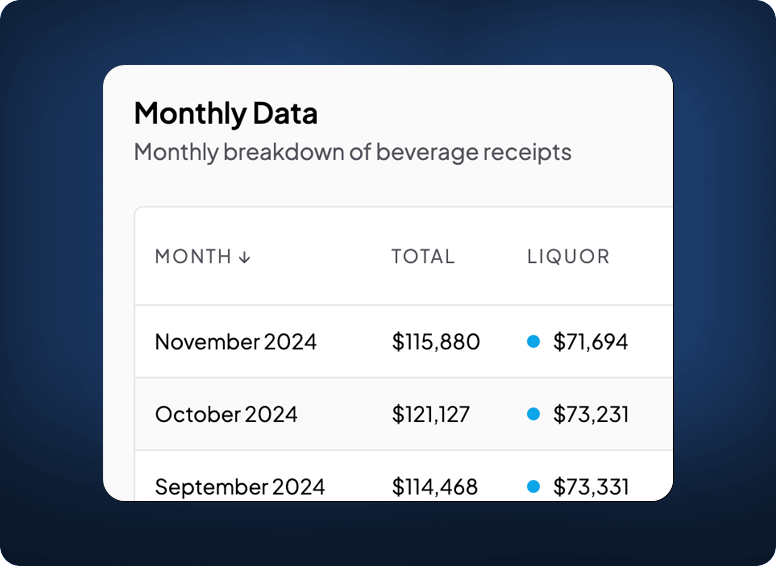
View any establishment’s entire alcohol sales history.
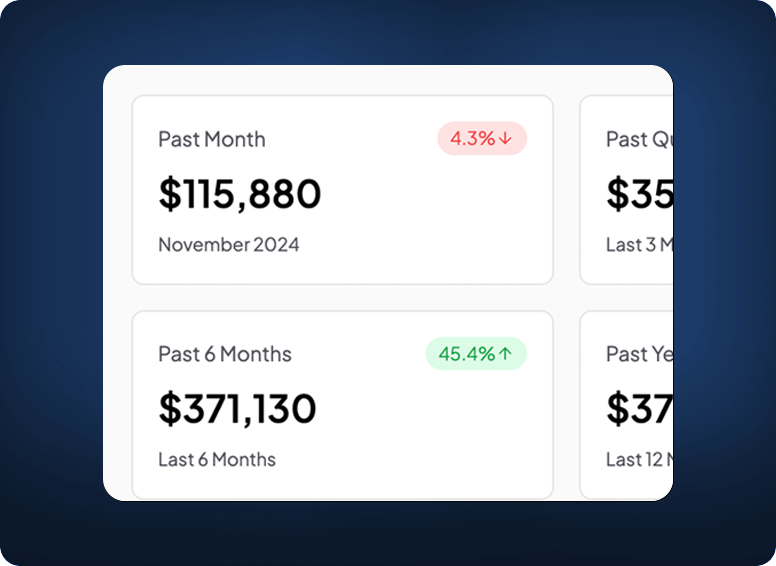
Access historical and current alcohol sales for every establishment in your market. Track month-by-month performance, yearly comparisons, and beverage category breakdowns through detailed reports.
Detailed info for any establishment
See any bar or restaurant’s taxpayer & permit information.
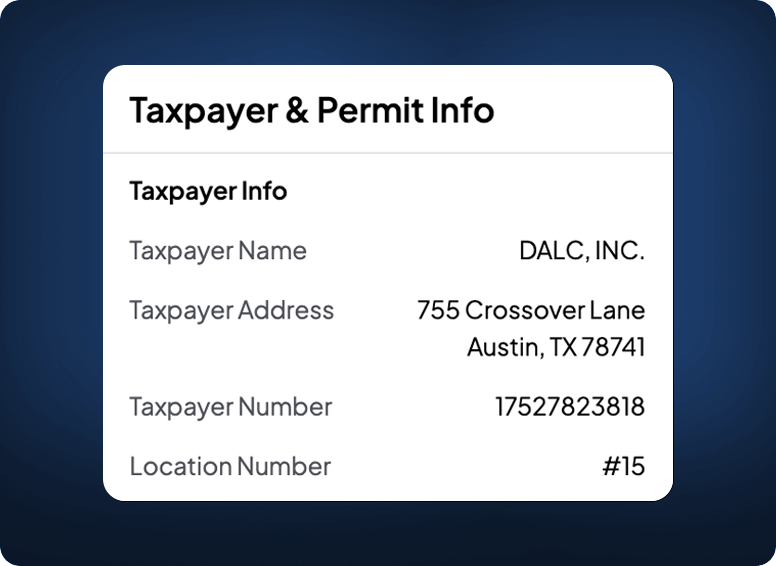
View essential business details including permit numbers, issue dates, taxpayer information, and location data for any Texas alcohol-serving establishment.
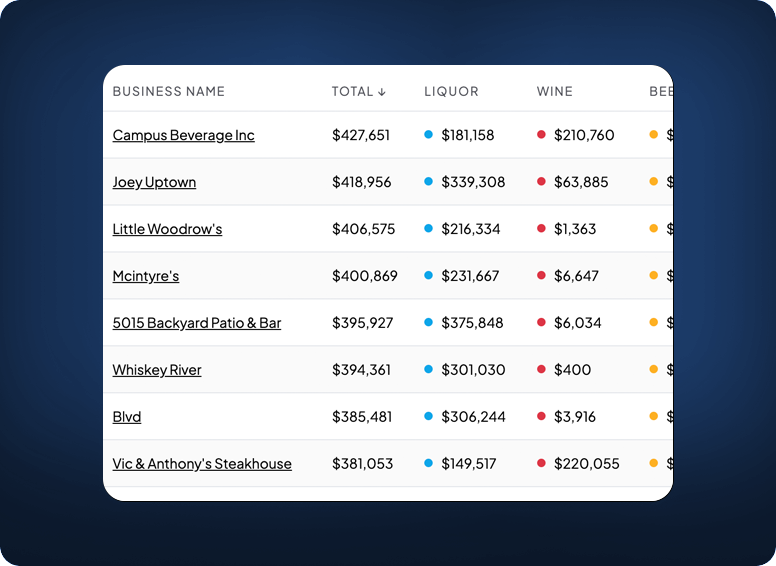
Sales broken down by alcohol type
View any establishment’s receipts broken down by the type of alcohol sold.
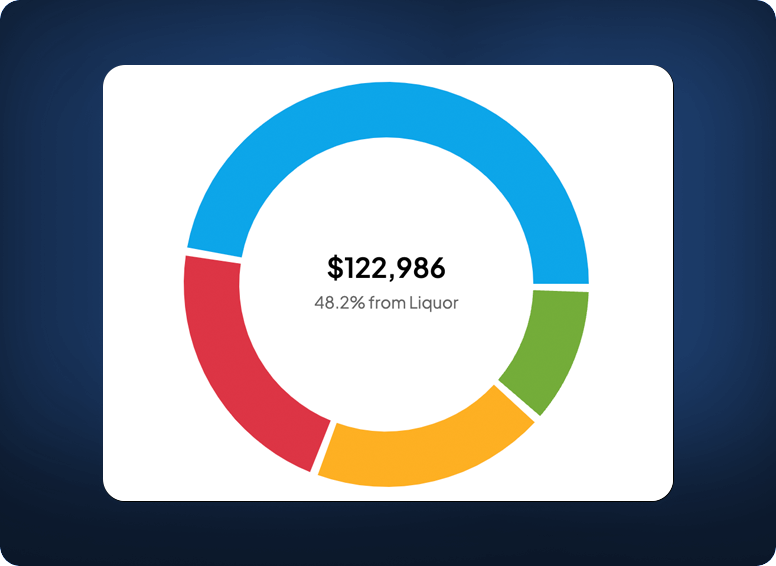
See a detailed breakdown of each establishment’s sales across beer, wine, liquor, and cover charges. Compare category performance across different time periods.
Generate a detailed sales breakdown for any Texas bar or restaurant.
Download detailed sales reports and analysis in your preferred format for seamless integration with your business workflow. Export single business data or create custom reports combining multiple establishments for deeper market insights and presentations.
-
PDF, CSV, Excel exports
-
Add to watchlist
-
Monthly sales data
-
Quarterly sales data
-
Yearly sales data
-
Two-year sales data
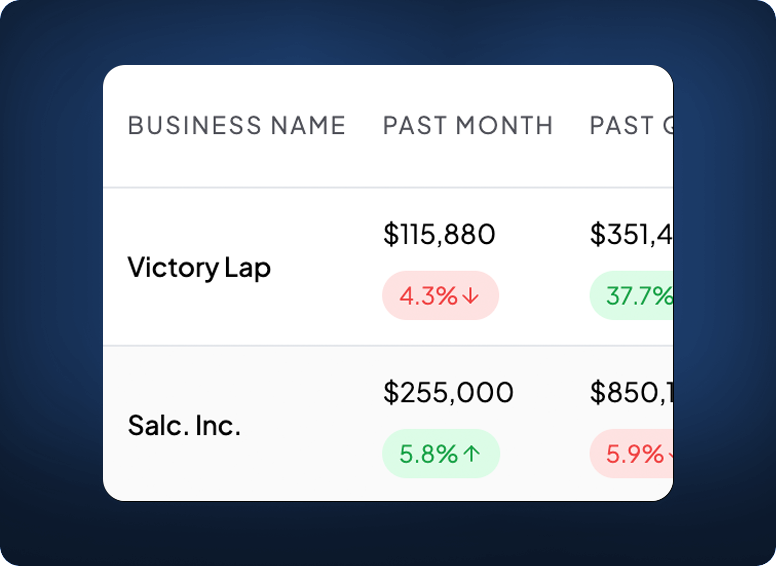
Create a watchlist of businesses to compare their sales over time.
Build a custom list of business to monitor and compare their alcohol sales performance over time. Easily track competitors, analyze market segments, or monitor specific locations of interest.
-
Monitor competitors
-
Track specific areas
-
Timeline chart view
-
Pivot table view
-
List view
Combine our powerful filters to get the exact data you need
Location search
Generate reports based on various location-based filters.
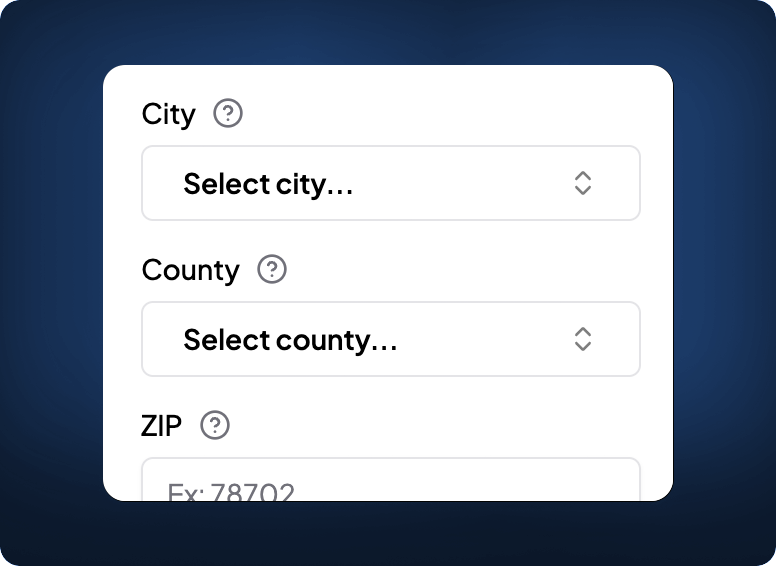
Filter by city, county, zip code, or street name. On top of that, optionally filter by business name to narrow it down even further.
Radius search
Find businesses within a certain radius of a point of your choosing.
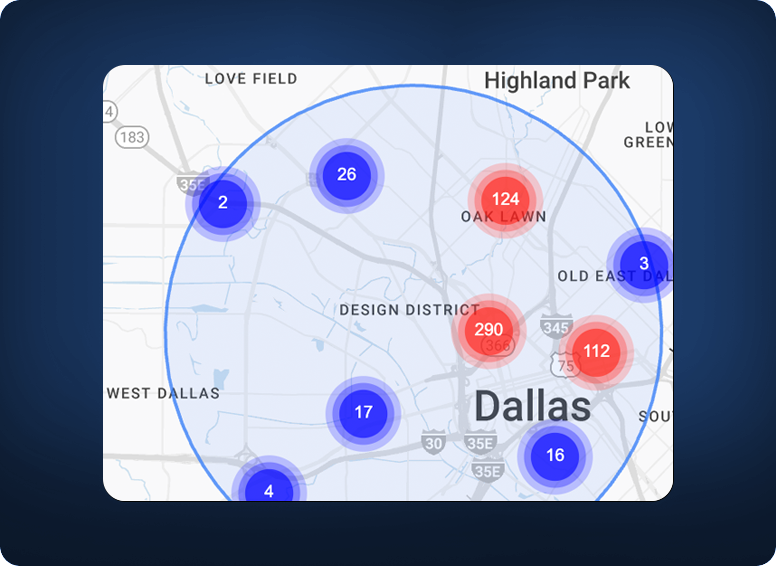
Enter a zip code and then select a radius of your choice, measured in miles. You’ll get a list of businesses within a certain radius of that zip.
Permit search
Find a specific business that matches the permit ID you enter.
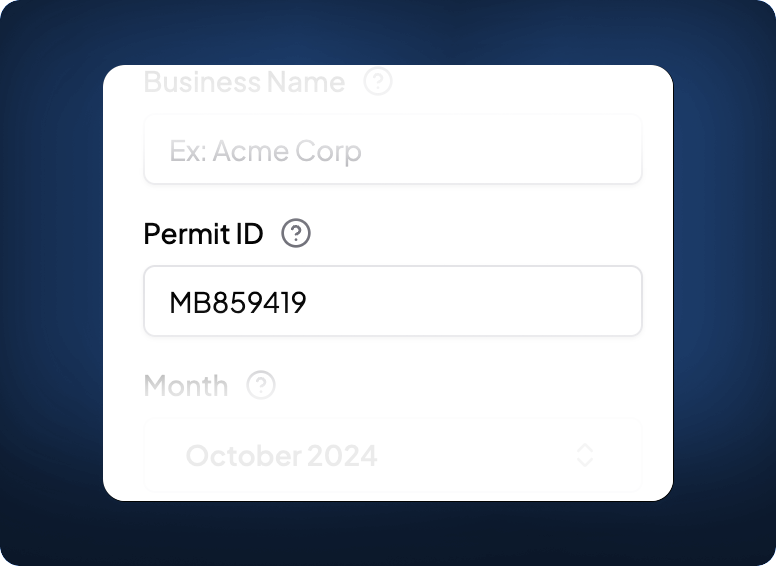
The permit search is useful to load a specific business if you happen to know that business’ permit ID.
Business name search
Search by business name to find specific businesses.
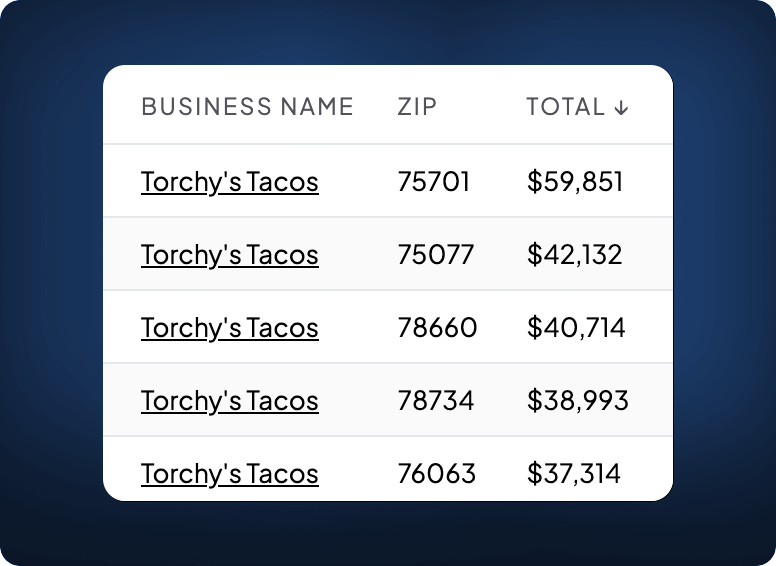
View information about a specific chain of businesses and compare how the various locations are doing against each other.
Month Search
Search by the most recent month or choose any month dating back decades.
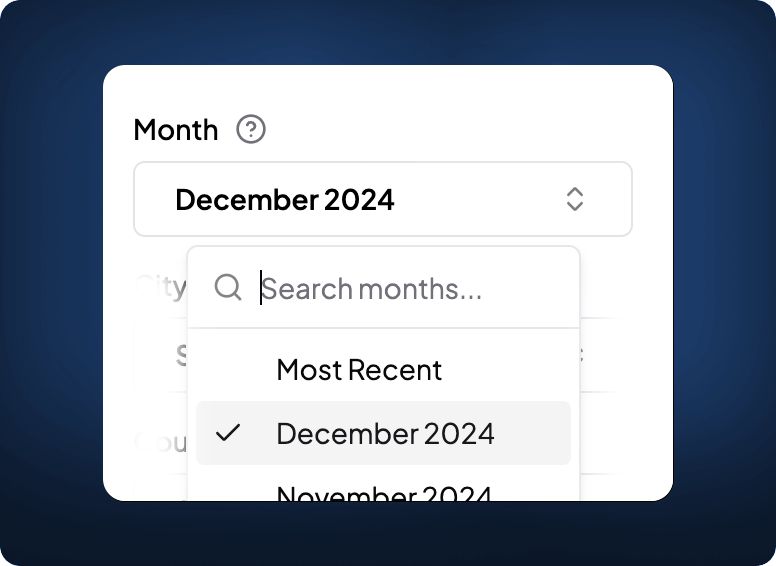
Compare month-over-month and year-over-year performance to spot patterns and growth for individual businesses.
Sales filter
Filter businesses by monthly sales range and volume.
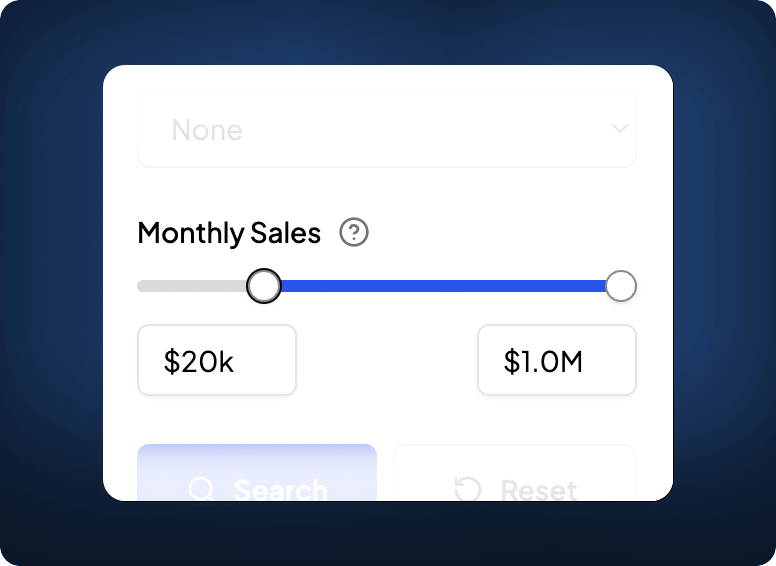
Find businesses based on their total monthly alcohol receipts, from small neighborhood bars to major entertainment venues selling up to $1M per month.
Analyze business data from a detailed table view.
After adding your filters, view and sort through comprehensive sales data in an organized table format. Sort, analyze, and export the information you need to make informed business decisions.
-
Sort by any column
-
Quick data filtering
-
Quick export options
-
Save the search for later
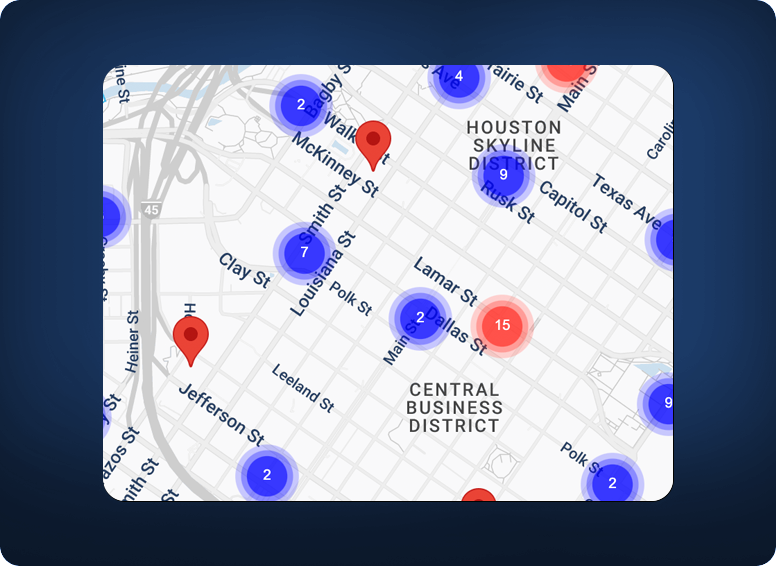
Interactive map view of alcohol sales in Texas
View all alcohol-serving establishments on an intuitive map interface. Quickly spot businesses in your area, analyze geographic concentrations, see high-sales areas using the heat map layer, and discover new opportunities in developing markets.
-
Visual location insights
-
Compare nearby competitors
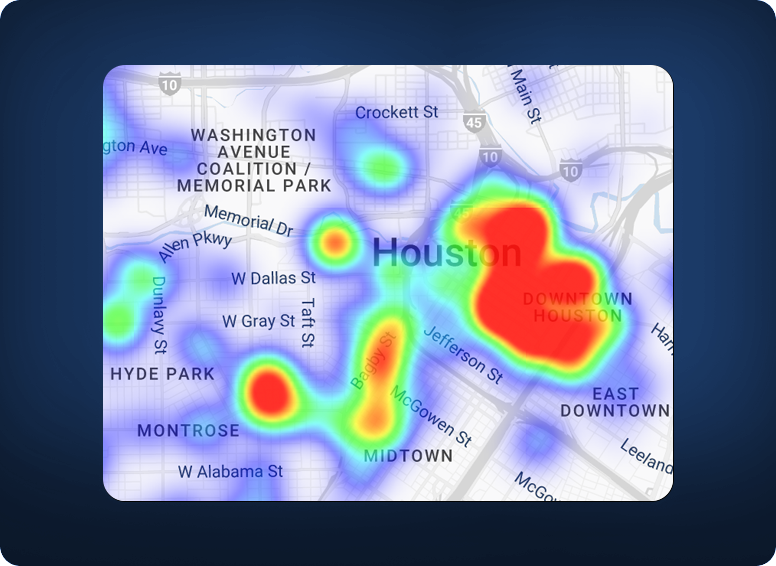
Heat map layer showing alcohol sales density
View alcohol sales density and hotspots across any area with our dynamic heat map. Quickly identify high-performing districts, nightlife clusters, and emerging entertainment zones.
-
Spot high-value areas instantly
-
Find hidden opportunities in developing districts
-
Track market saturation visually
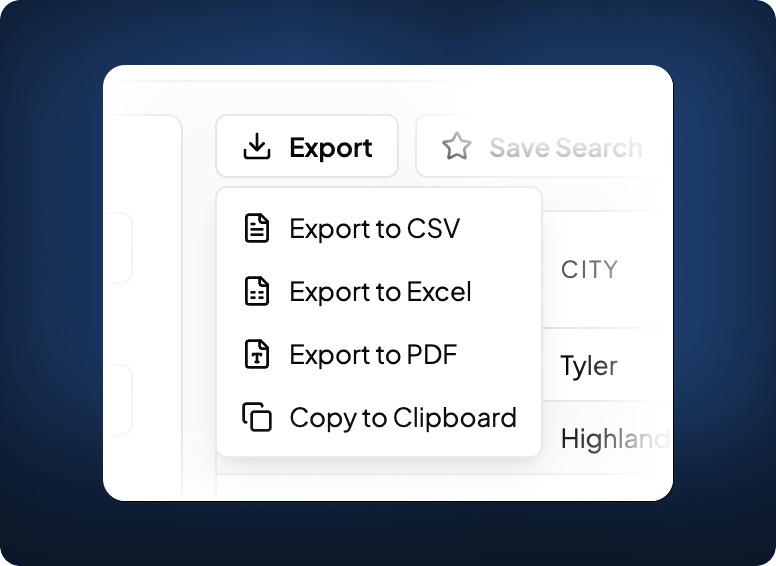
Multiple export and download options
Download or share your data in multiple formats with just one click. Export to CSV, Excel, or PDF, or quickly copy to your clipboard for instant use.
-
Multiple export formats available
-
Instant downloads and sharing
-
Easy data access for analysis
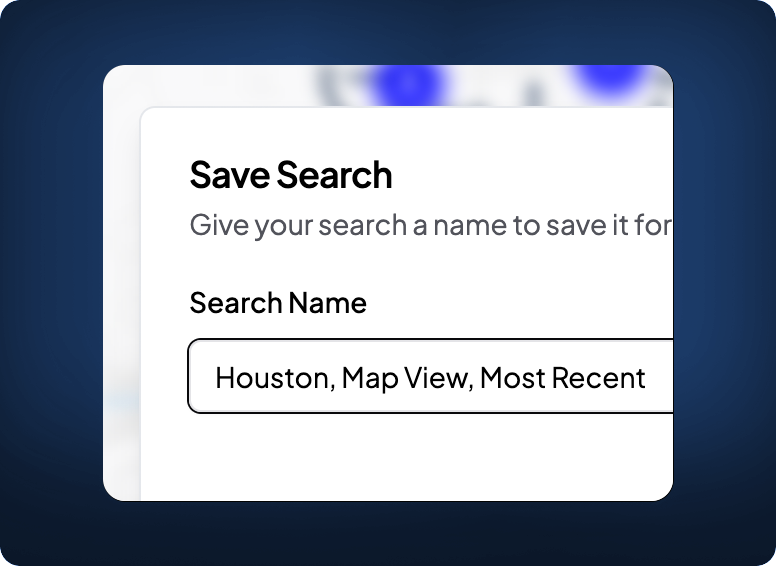
Save searches to easily run again later
Save your most-used searches and access them anytime. Quickly return to previous searches, track businesses over time, and monitor market changes effortlessly.
-
Save frequently used searches
-
Quick access to search history
-
Monitor businesses automatically
All of our features, just one price.
-
Every bar & restaurant in Texas
-
Data directly from TABC
-
Always the most recent data
-
Powerful searching & filtering
-
Create custom reports
-
Interactive map view
-
Custom business watchlist
-

“I’ve been using TABS report for several years now. We have 5 Shakertins locations in the DFW area, and it’s great having access to sales in each city that we have a location in. The Reports feature makes the site very easy to use. Thanks for the quality service over the years!”
Brad Hawkins
Founding Partner, Shakertins